简介:本文主要讲述如何建立应用业务指标Metrics监控和如何实现精准告警。Metrics可以翻译为度量或者指标,指的是对于一些关键信息以可聚合的、数值的形式做定期统计,并绘制出各种趋势图表。透过它,我们可以观察系统的状态与趋势。
赵君|南京爱福路汽车科技有限公司基础设施部云原生工程师,过去一直从事java相关的架构和研发工作。目前主要负责公司的云原生落地相关工作,负责F6基础设施和业务核心应用全面上云和云原生化改造。
徐航|南京爱福路汽车科技有限公司基础设施部云原生工程师,过去一直负责数据库高可用以及相关运维和调优工作。目前主要负责研发效能DevOps的落地以及业务系统云原生可观测性的改造。
随着分布式架构逐渐成为了架构设计的主流,可观测性(Observability)一词也日益被人频繁地提起。
2017年的分布式追踪峰会(2017DistributedTracingSummit)结束后,PeterBourgon撰写了总结文章《Metrics,Tracing,andLogging》系统地阐述了这三者的定义、特征,以及它们之间的关系与差异。文中将可观测性问题映射到了如何处理指标(metrics)、追踪(tracing)、日志(logging)三类数据上。
其后,CindySridharan在其著作《DistributedSystemsObservability》中,进一步讲到指标、追踪、日志是可观测性的三大支柱(threepillars)。

到了2018年,CNCFLandscape率先出现了Observability的概念,将可观测性(Observability)从控制论(Cybernetics)中引入到IT领域。在控制论中,可观测性是指系统可以由其外部输出,来推断其内部状态的程度,系统的可观察性越强,我们对系统的可控制性就越强。
可观测性可以解决什么问题?GoogleSREBook第十二章给出了简洁明快的答案:快速排障。
本文主要讲述如何建立应用业务指标Metrics监控和如何实现精准告警。Metrics可以翻译为度量或者指标,指的是对于一些关键信息以可聚合的、数值的形式做定期统计,并绘制出各种趋势图表。透过它,我们可以观察系统的状态与趋势。
技术栈选择我们的应用都是SpringBoot应用,并且使用SpringBootActuator实现应用的健康检查。从开始,Actuator将底层改为Micrometer,提供了更强、更灵活的监测能力。Micrometer支持对接各种监控系统,包括Prometheus。
所以我们选择Micrometer收集业务指标,Prometheus进行指标的存储和查询,通过Grafana进行展示,通过阿里云的告警中心实现精准告警。
指标收集对于整个研发部门来说,应该聚焦在能够实时体现公司业务状态的最核心的指标上。例如Amazon和eBay会跟踪销售量,Google和Facebook会跟踪广告曝光次数等与收入直接相关的实时指标。
Prometheus默认采用一种名为OpenMetrics的指标协议。OpenMetrics是一种基于文本的格式。下面是一个基于OpenMetrics格式的指标表示格式样例。
TYPEhttp_requests_totalcounterhttp_requests_total{method="post",code="200"}1027http_requests_total{method="post",code="400"}3Minimalisticline:metric_without_timestamp_and_,whichhasaprettycomplexrepresentationinthetextformat:TYPEhttp_request_duration_secondshistogramhttp_request_duration_seconds_bucket{le="0.05"}24054http_request_duration_seconds_bucket{le="0.1"}33444http_request_duration_seconds_bucket{le="0.2"}100392http_request_duration_seconds_bucket{le="0.5"}129389http_request_duration_seconds_bucket{le="1"}133988http_request_duration_seconds_bucket{le="+Inf"}144320http_request_duration_seconds_sum53423http_request_duration_seconds_count144320HELPrpc_duration_secondsAsummaryoftheRPCdurationinseconds.#TYPErpc_duration_secondssummaryrpc_duration_seconds{quantile="0.01"}3102rpc_duration_seconds{quantile="0.05"}3272rpc_duration_seconds{quantile="0.5"}4773rpc_duration_seconds{quantile="0.9"}9001rpc_duration_seconds{quantile="0.99"}76656rpc_duration_seconds_+07rpc_duration_seconds_count2693指标的数据由指标名(metric_name),一组key/value标签(label_name=label_value),数字类型的指标值(value),时间戳组成。
metric_name["{"label_name"="`"`label_value`"`{","label_name"="`"`label_value`"`}[","]"}"]value[timestamp]MeterMicrometer提供了多种度量类库(Meter),Meter是指一组用于收集应用中的度量数据的接口。Micrometer中,Meter的具体类型包括:Timer,Counter,Gauge,DistributionSummary,LongTaskTimer,FunctionCounter,FunctionTimer,andTimeGauge
Counter用来描述一个单调递增的变量,如某个方法的调用次数,缓存命中/访问总次数等。支持配置recordFailuresOnly,即只记录方法调用失败的次数。Counter的指标数据,默认有四个label:class,method,exception,result。
Timer会同时记录totalcount,sumtime,maxtime三种数据,有一个默认的label:exception。
Gauge用来描述在一个范围内持续波动的变量。Gauge通常用于变动的测量值,比如队列中的消息数量,线程池任务队列数等。
DistributionSummary用于统计数据分布。
应用接入流程为了方便微服务应用接入,我们封装了micrometer-spring-boot-starter。micrometer-spring-boot-starter的具体实现如下。
1.引入SpringBootActuator依赖
/groupIdartifactIdspring-boot-starter-actuator/artifactId//groupIdartifactIdmicrometer-registry-prometheus/artifactIdversion${}/version/depency2.进行初始配置
Actuator默认开启了一些指标的收集,比如system,jvm,http,可以通过配置关闭它们。其实仅仅是我们需要关闭,因为我们已经接了jmxexporter了。
===false
如果不希望Web应用的Actuator管理端口和应用端口重合的话,可以使用设置独立的端口。这是好的实践,可以看到黑客针对actuator的攻击,但是换了端口号,不暴露公网问题会少很多。
1=xxxx
3.配置springbean
TimedAspect的()是故意的,防止产生太长的class名称对prometheus造成压力。
@PropertySource(value={"classpath:/"})@ConfigurationpublicclassMetricsConfig{@BeanpublicTimedAspecttimedAspect(MeterRegistryregistry){returnnewTimedAspect(registry,(pjp)-());}@BeanpublicCountedAspectcountedAspect(MeterRegistryregistry){returnnewCountedAspect(registry);}@BeanpublicPrometheusMetricScrapepointprometheusMetricScrapepoint(CollectorRegistrycollectorRegistry){returnnewPrometheusMetricScrapepoint(collectorRegistry);}@BeanpublicPrometheusMetricScrapeMvcpointprometheusMvcpoint(PrometheusMetricScrapepointdelegate){returnnewPrometheusMetricScrapeMvcpoint(delegate);}}应用接入时,引入micrometer-spring-boot-starter依赖
depencygroupIdxxx/groupIdartifactIdmicrometer-spring-boot-starter/artifactId/depency
现在,就可以通过访问http://ip:port/actuator/prometheus,来查看Micrometer记录的数据。
自定义业务指标Micrometer内置了Counted和Timed两个annotation。可以通过在对应的方法上加上@Timed和@Counted注解,来收集方法的调用次数,时间和是否发生异常等信息。
@Timed
如果想要记录打印方法的调用次数和时间,需要给print方法加上@Timed注解,并给指标定义一个名称。
@Timed(value="",percentiles={0.95,0.99},description="metricsofprint")publicStringprint(PrintDataprintData){}在print方法上加上@Timed注解之后,Micrometer会记录print方法的调用次数(count),方法调用最大耗时(max),方法调用总耗时(sum)三个指标。percentiles={0.95,0.99}表示计算p95,p99的请求时间。记录的指标数据如下。
biz_print_seconds_count{exception="none"}4.0biz_print_seconds_sum{exception="none"}7.783213927biz_print_seconds_max{exception="none"}6.14639717biz_print_seconds{exception="NullPointerException"}0.318767104biz_print_seconds{exception="none",quantile="0.95",}0.58720256biz_print_seconds{exception="none",quantile="0.99",}6.157238272@Timed注解支持配置一些属性:
value:必填,指标名
extraTags:给指标定义标签,支持多个,格式{"key","value","key","value"}
percentiles:小于等于1的数,计算时间的百分比分布,比如p95,p99
histogram:记录方法耗时的histogram直方图类型指标
@Timed会记录方法抛出的异常。不同的异常会被记录为独立的数据。代码逻辑是先catch方法抛出的异常,记录下异常名称,然后再抛出方法本身的异常:
try{();}catch(Exceptionex){exceptionClass=().getSimpleName();throwex;}finally{try{((metricName).description(().isEmpty()?null:()).tags(()).tags(EXCEPTION_TAG,exceptionClass).tags((pjp)).publishPercentileHistogram(()).publishPercentiles(().length==0?null:()).register(registry));}catch(Exceptione){//ignoringonpurpose}}@Counted
如果不关心方法执行的时间,只关心方法调用的次数,甚至只关心方法调用发生异常的次数,使用@Counted注解是更好的选择。recordFailuresOnly=true表示只记录异常的方法调用次数。
@Timed(value="",recordFailuresOnly=true,description="metricsofprint")publicStringprint(PrintDataprintData){}记录的指标数据如下。
biz_print_failure_total{class="",exception="NullPointerException",method="print",result="failure",}4.0counter是一个递增的数值,每次方法调用后,会自增1。privatevoidrecord(ProceedingJoinPointpjp,Countedcounted,Stringexception,Stringresult){counter(pjp,counted).tag(EXCEPTION_TAG,exception).tag(RESULT_TAG,result).register(meterRegistry).increment();}(ProceedingJoinPointpjp,Countedcounted){=(()).tags((pjp));Stringdescription=();if(!()){(description);}returnbuilder;}Gauge
Gauge用来描述在一个范围内持续波动的变量。Gauge通常用于变动的测量值,例如雪花算法的workId,打印的模板id,线程池任务队列数等。
注入PrometheusMeterRegistry
构造Gauge。给指标命名并赋值。
@AutowiredprivatePrometheusMeterRegistrymeterRegistry;publicvoidbuildGauge(LongworkId){("",workId,Long::longValue).description("alphardsnowFlakeIdGeneratorworkId").tag("workId",()).register(meterRegistry).measure();}记录的指标数据如下。
biz_alphard_snowFlakeIdGenerator_workId{workId="2"}2配置SLA指标如果想要记录指标时间数据的sla分布,Micrometer提供了对应的配置:
[]=300ms,400ms,500ms,1s,10s
记录的指标数据如下。
biz_print_seconds_bucket{exception="none",le="0.3",}1.0biz_print_seconds_bucket{exception="none",le="0.4",}3.0biz_print_seconds_bucket{exception="none",le="0.5",}10.0biz_print_seconds_bucket{exception="none",le="0.6",}11.0biz_print_seconds_bucket{exception="none",le="1.0",}11.0biz_print_seconds_bucket{exception="none",le="10.0",}12.0biz_print_seconds_bucket{exception="none",le="+Inf",}12.0存储查询我们使用Prometheus进行指标数据的存储和查询。Prometheus采用拉取式采集(Pull-BasedMetricsCollection)。Pull就是Prometheus主动从目标系统中拉取指标,相对地,Push就是由目标系统主动推送指标。Prometheus官方解释选择Pull的原因。
PullingoverHTTPoffersanumberofadvantages:
Youcanrunyourmonitoringonyourlaptopwhevelopingchanges.
Youcanmoreeasilytellifatargetisdown.
Youcanmanuallygotoatargetandinspectitshealthwithawebbrowser.
Overall,webelievethatpullingisslightlybetterthanpushing,butitshouldnotbeconsideredamajorpointwhenconsideringamonitoringsystem.
Prometheus也支持Push的采集方式,就是Pushgateway。
Forcaseswhereyoumustpush,weofferthePushgateway.
为了让Prometheus采集应用的指标数据,我们需要做两件事:
1.应用通过service暴露出actuator端口,并添加label:monitor/metrics
apiVersion:v1kind:Servicemetadata:name:print-svclabels:monitor/metrics:""spec:ports:-name:custom-metricsport:xxxxtargetPort:xxxxprotocol:TCPtype:ClusterIPselector:app:print-test
2.添加ServiceMonitor
apiVersion:/v1kind:ServiceMonitormetadata:name:metricslabels:app:metric-monitorspec:namespaceSelector:any:truepoints:-interval:15sport:custom-metricspath:"/manage/prometheusMetric"selector:matchLabels:monitor/metrics:""
Prometheus会定时访问service的points(http://podip:port/manage/prometheusMetric),拉取应用的metrics,保存到自己的时序数据库。
Prometheus存储的数据是文本格式,虽然Prometheus也有Graph,但是不够炫酷,而且功能有限。还需要有一些可视化工具去展示数据,通过标准易用的可视化大盘去获知当前系统的运行状态。比较常见的解决方案就是Grafana。Prometheus内置了强大的时序数据库,并提供了PromQL的数据查询语言,能对时序数据进行丰富的查询、聚合以及逻辑运算。通过在Grafana配置Prometheus数据源和PromQL,让Grafana去查询Prometheus的指标数据,以图表的形式展示出来。
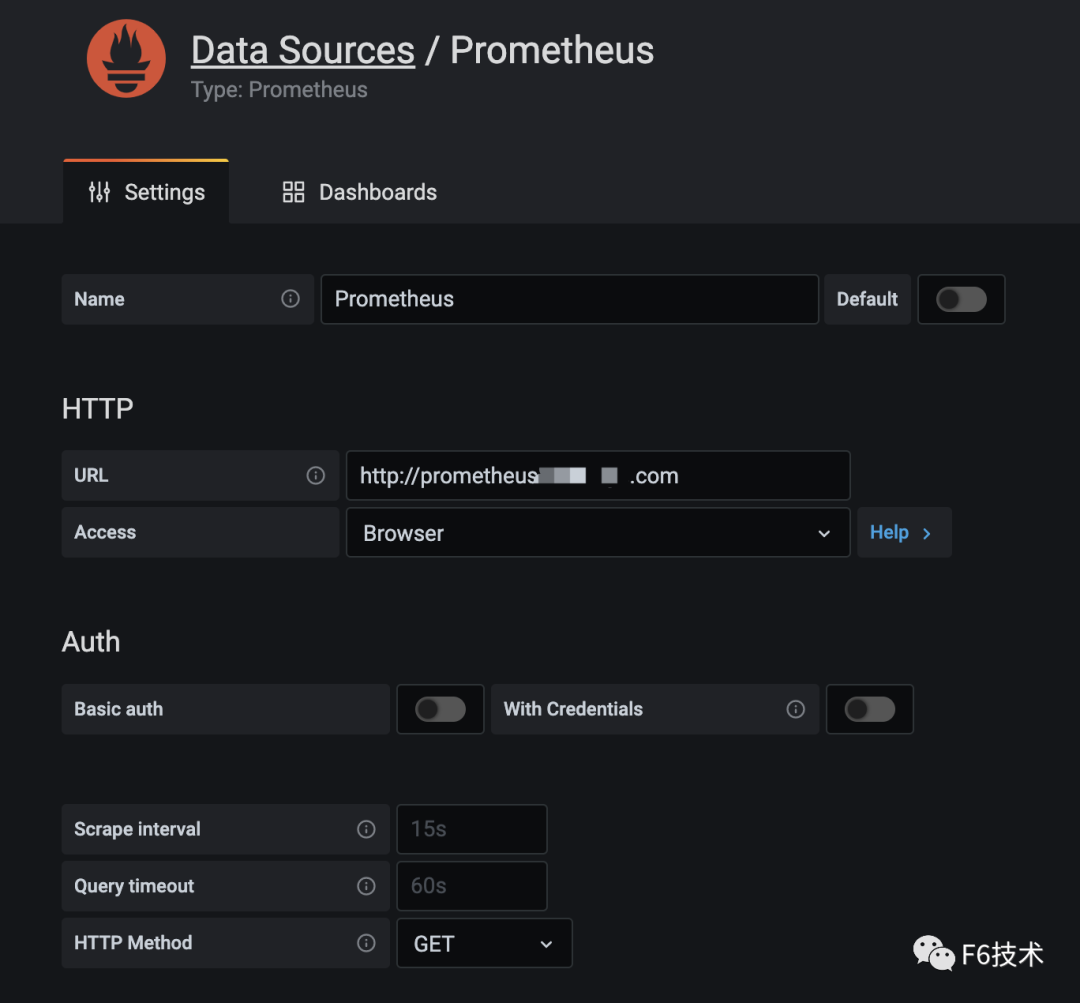
1.grafana配置Prometheus数据源
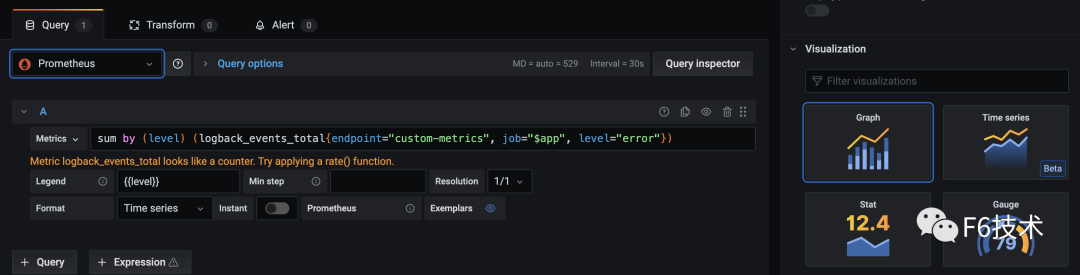
2.添加看板,配置数据源,query语句,图表样式
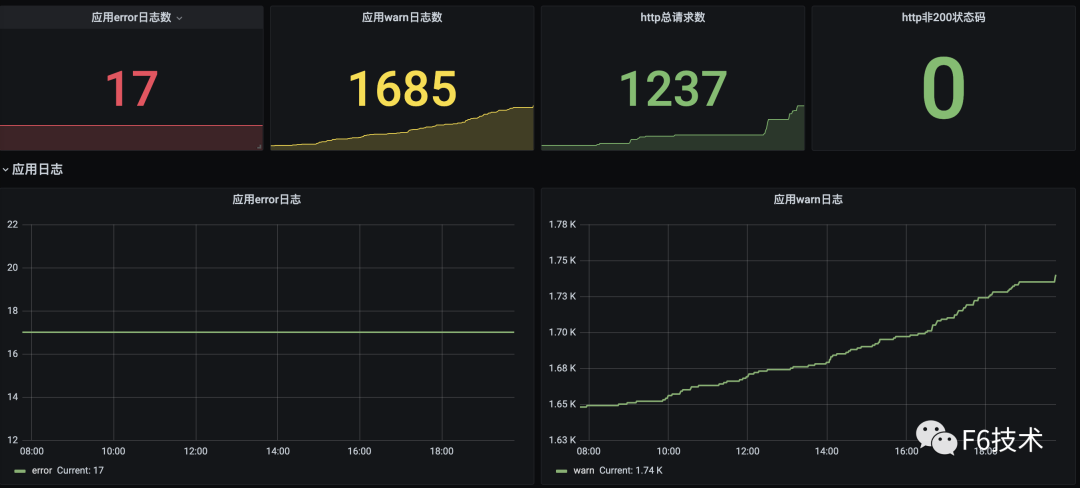
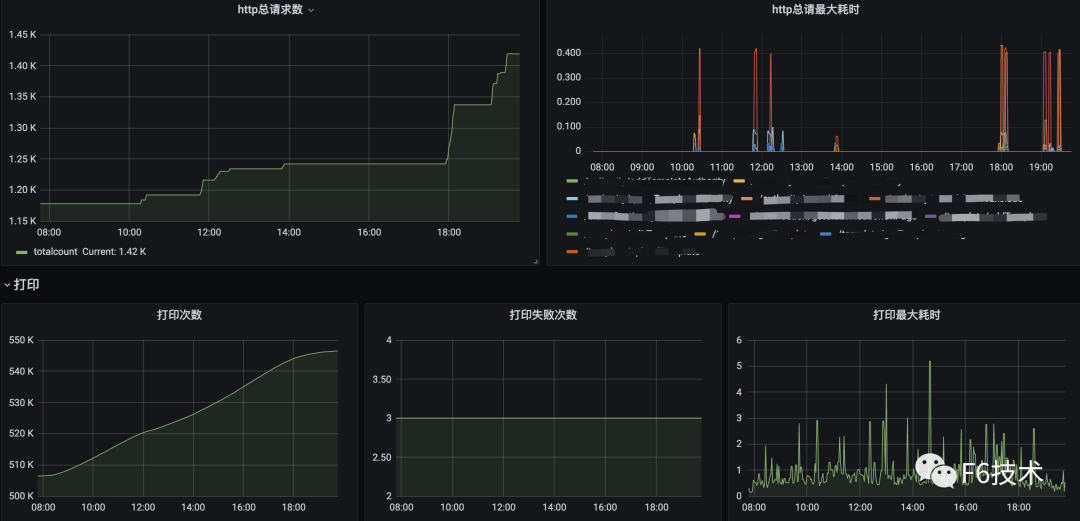
3.可以在一个dasborad添加多个看板,构成监控大盘。
任何系统都不是完美的,当出现异常和故障时,能在第一时间发现问题且快速定位问题原因就尤为重要。但要想做到以上这两点,只有数据收集是不够的,需要依赖完善的监控和告警体系,迅速反应并发出告警。
我们最初的方案是,基于Prometheusoperator的PrometheusRule创建告警规则,Prometheusservers把告警发送给Alertmanager,Alertmanager负责把告警发到钉钉群机器人。但是这样运行一段时间之后,我们发现这种方式存在一些问题。SRE团队和研发团队负责人收到的告警太多,所有的告警都发到一个群里,打开群消息,满屏的告警标题,告警级别,告警值。其中有需要运维处理的系统告警,有需要研发处理的应用告警,信息太多,很难快速筛选出高优先级的告警,很难快速转派告警到对应的处理人。所以我们希望应用告警可以精准发送到应用归属的研发团队。
经过一段时间的调研,我们最终选择阿里云的《ARMS告警运维中心》来负责告警的管理。ARMS告警运维中心支持接入Prometheus数据源,支持添加钉钉群机器人作为联系人。
1.收集研发团队的钉钉群机器人的webhook地址,创建机器人作为联系人。
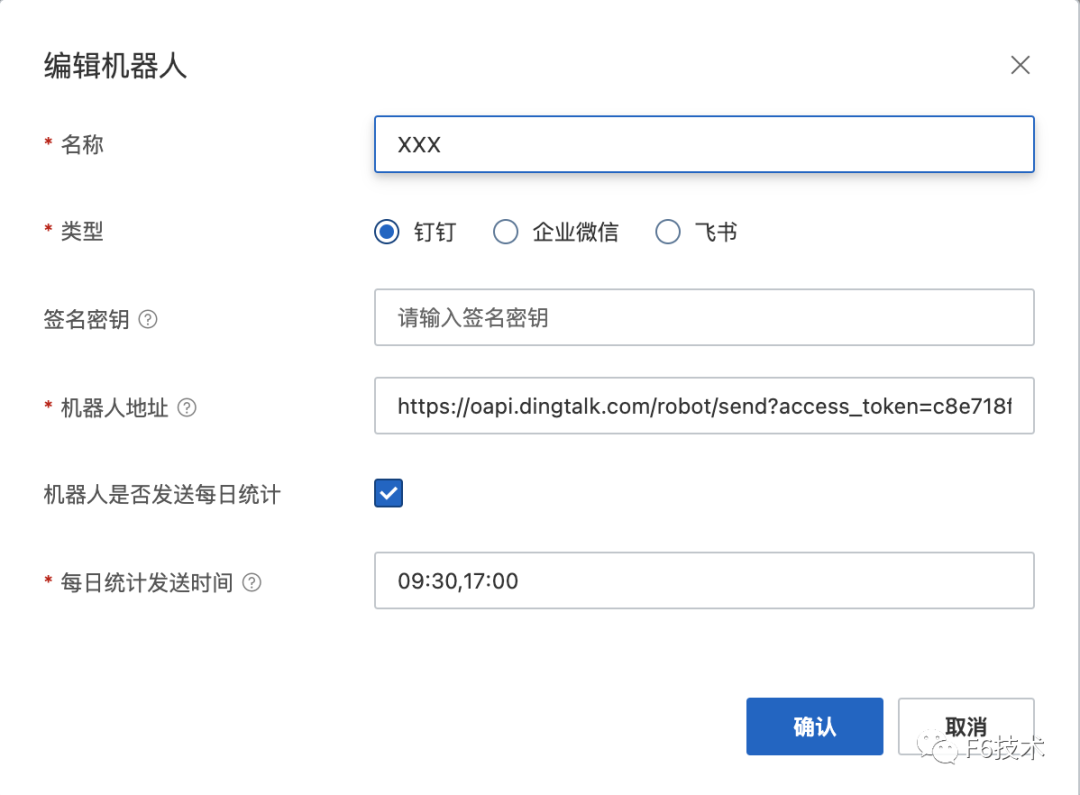
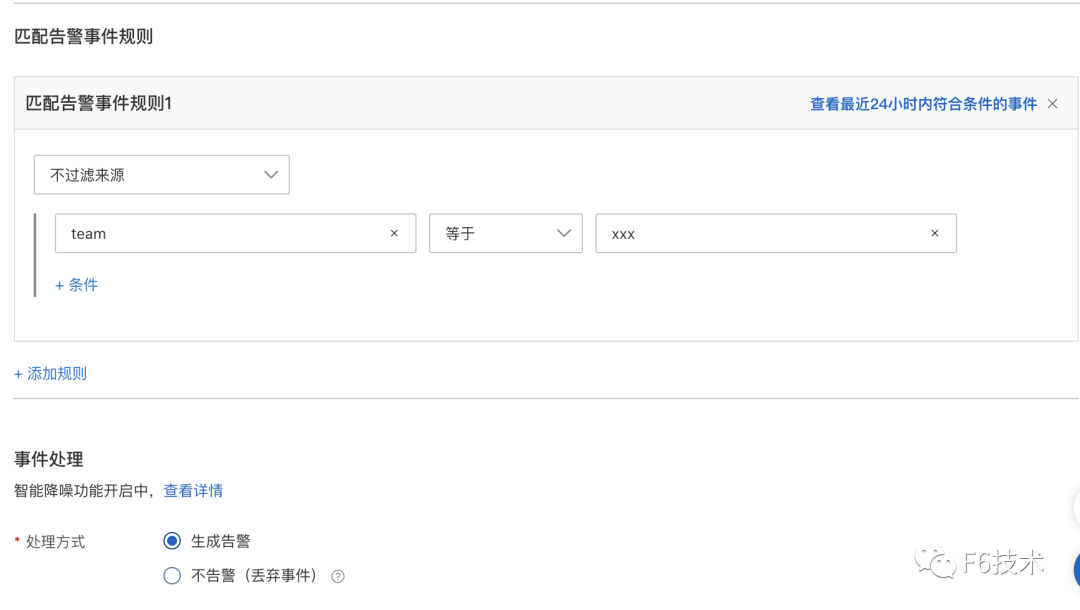
2.给每个研发团队分别配置通知策略,通知策略筛选告警信息里的team字段,并绑定对应的钉钉群机器人联系人。
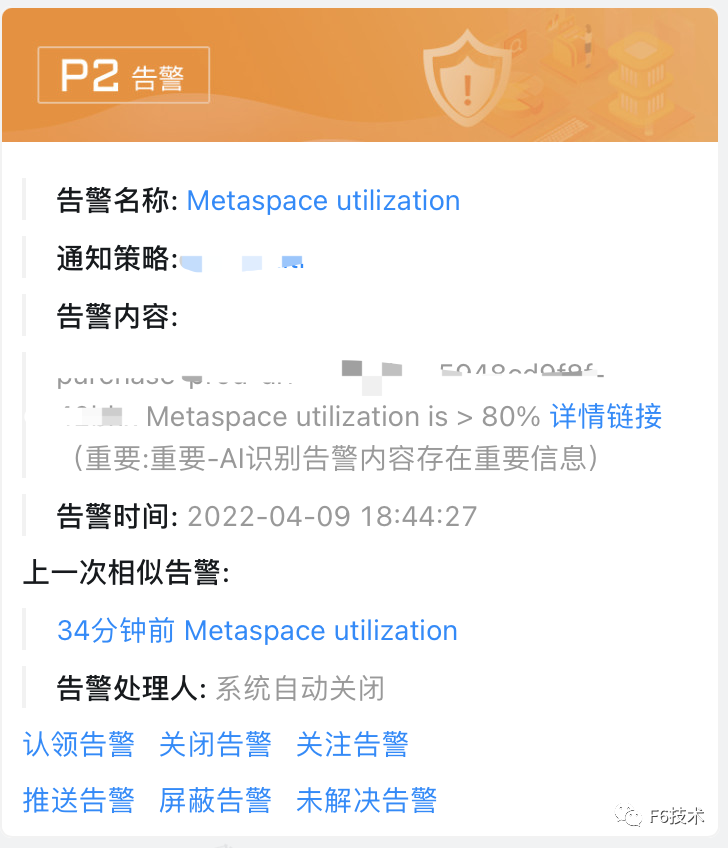
通过这个方式,实现了应用的告警直接发送到对应的研发团队,节省了信息筛选和二次转派的时间,提高了告警处理效率。
效果如下:
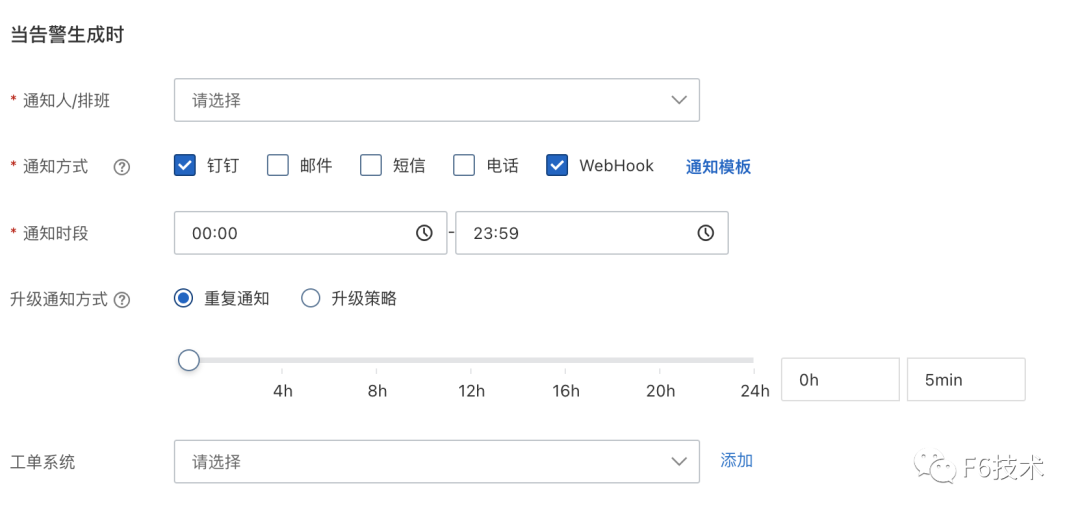
ARMS告警运维中心支持接入grafana,zabbix,arms等多种数据源,具有告警分派和认领,告警汇总去重,通过升级通知方式对长时间没有处理的告警进行多次提醒,或升级通知到领导,保证告警及时解决。
本文为阿里云原创内容,未经允许不得转载。


收玉米")